Your signup numbers look fine. Your trial volume looks fine. Then you check trial-to-paid conversion and the number makes no sense, because somewhere between those two points, you’re losing people and you don’t know where.
That gap is exactly what SaaS funnel analytics fixes.
SaaS funnel analytics is the practice of tracking how users move through the stages of your product. It measures conversion and drop-off at each step, then uses that data to find and fix the points where you lose the most customers.
This guide covers the key metrics that matter and how to set up funnels without a data team. You’ll also find how AI can prioritize what to fix first, plus the compliance basics most SaaS guides skip entirely.
Key Takeaway
- SaaS funnel analytics turns “users are dropping off somewhere” into a specific, fixable answer about which step and why.
- A handful of funnel metrics drive most decisions: conversion rate, customer acquisition cost, churn rate, and customer lifetime value.
- You don’t need SQL knowledge to build a reliable simple funnel. FullSession, a behavioral analytics platform for SaaS teams, lets you define steps visually and watch the sessions behind every drop.
- Predictive analytics and AI prioritization, like FullSession’s Lift AI, help product teams act on funnel insights without drowning in dashboards.
- Funnel tracking touches personal and demographic data, so GDPR and CCPA basics belong in your rollout plan.
FullSession brings funnel tracking, session replay, and AI-driven prioritization into one platform, so you don’t need a separate tool for each piece of the puzzle. That combination makes it easier to go from “users are dropping off” to a specific fix you can ship this week.
Why Funnel Analysis Drives SaaS Growth
The Model Context Protocol is an open standard from Anthropic (November 2024) that lets AI assistants connect to Funnel analysis turns acquisition spend into a clear, fixable system instead of a black box. Every dollar you spend on ads, content, or outreach only pays off if the people it brings in actually convert. When your funnel leaks, you’re quietly inflating your customer acquisition cost on every channel you run.
You can’t out-spend a broken funnel, which is why funnel analysis tools matter more for business growth than almost any other lever you have.
The math behind a leaky funnel
Say you spend $10,000 to bring in 1,000 trial signups, and 5% convert to paid. That’s 50 satisfied customers at $200 each. Improve trial-to-paid conversion to 10% with the exact same traffic and spend, and you’ve doubled your customer count without touching your marketing budget.
Sustainable growth comes from understanding where in your sales process users actually stall, then fixing that specific step.
What happens when teams skip funnel analysis
Marketing teams who skip this step run into a familiar set of problems:
- They debate opinions instead of looking at data-driven decisions.
- They spend more to chase the same number of customers, instead of converting more of the traffic they already have.
- They optimize the loudest complaint instead of the step actually losing the most users.
That’s a slower way to grow. The real question isn’t how many users you can attract. It’s about moving the users you already have forward through your SaaS marketing funnel.
Key SaaS Funnel Stages (and How to Define Them)
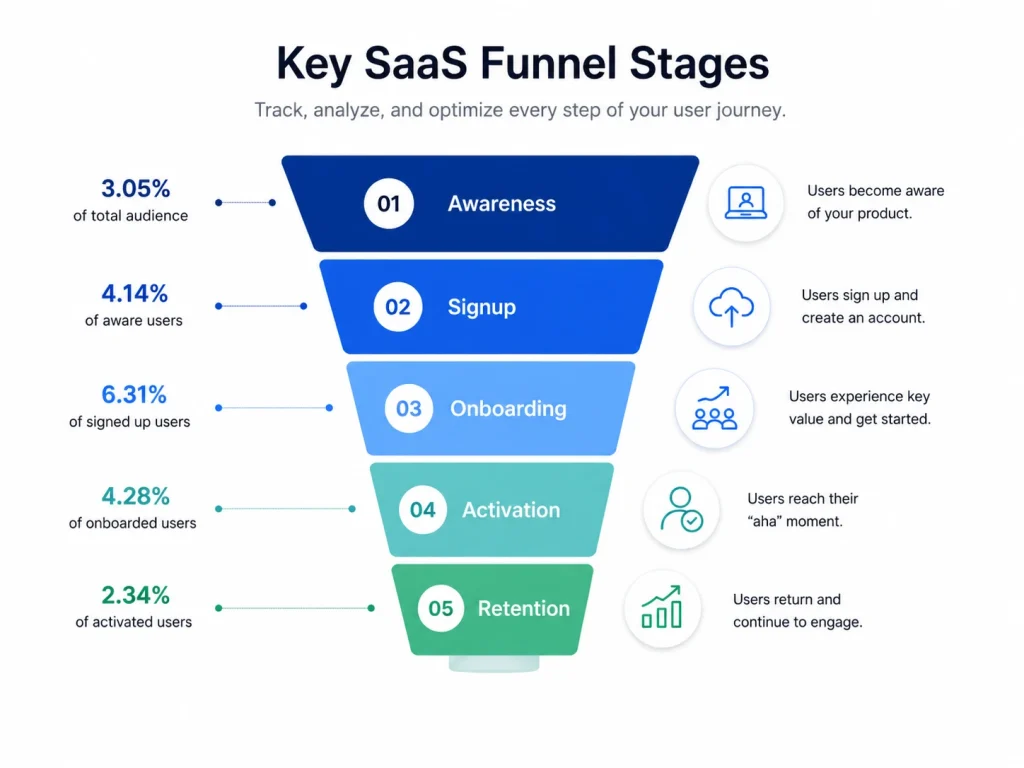
A SaaS funnel has four core stages: awareness, trial or activation, conversion, and retention. Unlike simple sales funnels built for a single purchase, SaaS conversion funnels keep going after the first payment. Each stage represents a different decision the user is making, and each needs its own funnel metrics.
- Awareness: A potential customer discovers your product and decides whether it’s worth a closer look.
- Trial or activation: A signed-up user decides whether your product actually solves their problem.
- Conversion: A trial user decides whether to upgrade to a paid version and become one of your converting users.
- Retention: An existing customer decides, every renewal cycle, whether to stay.
Notice that retention isn’t an afterthought here. It’s a full stage with its own simple conversion tracking, because in a subscription business, the sale doesn’t end the customer journey. It starts it.
For a full breakdown of how these stages map to specific conversion benchmarks and a 30/60/90 day action plan, see our guide to the SaaS conversion funnel. This article focuses on the funnel analysis tools you need to measure each stage well.
Core SaaS Funnel Metrics to Track
Six metrics drive most funnel decisions: conversion rate, customer acquisition cost, churn rate, customer lifetime value, net promoter score, and feature adoption. These SaaS funnel metrics work together, and tracking them consistently helps you catch issues before they become revenue problems.
Conversion rate
Conversion rate is the percentage of users who move from one funnel step to the next, and the benchmark you should compare against depends heavily on your trial model.
According to ChartMogul, in partnership with ProductLed, the SaaS growth community and content platform, the median free-to-paid conversion rate across 200 B2B software products surveyed in January 2026 was 8%. Free trials requiring a credit card converted at roughly 30%.
According to First Page Sage, opt-in free trials convert to paid at an average of 18.2%, while opt-out trials requiring a credit card upfront convert at 48.8%. Know your model before tracking conversion rates against a generic average.
Customer acquisition cost and churn rate
Customer acquisition cost (CAC) is your total sales and marketing spend divided by new customers gained. You need it next to customer lifetime value, often shortened to CLV, to know if your funnel is actually profitable.
Churn rate measures the percentage of paying customers who cancel in a given period. A 5% monthly churn rate sounds small until you realize it means losing more than half your user base in a year.
Customer satisfaction, loyalty, and NPS
Customer satisfaction feeds directly into both churn rate and customer loyalty. Teams that survey existing customers right after a cancellation or a downgrade learn far more than teams that only ask happy customers for feedback.
Net promoter score (NPS) measures how likely satisfied customers are to recommend you, and it’s a leading indicator of churn long before the cancellation actually happens.
Feature adoption
Feature adoption tracks what percentage of new users actually use a given feature. Feature usage data often explains weak product adoption better than any survey can.
The SaaS funnel metrics map
| Funnel Stage | Core Metrics | Benchmark Range | How to Track It |
| Awareness | Organic traffic, bounce rate | Varies by channel and industry | Web analytics tools, heatmaps |
| Trial/Activation | Activation rate, time to first value | 35-45% activation is typical mid-range | Funnel analysis tools, session replay |
| Conversion | Trial-to-paid conversion rate | 18.2% (opt-in) to 48.8% (opt-out), per First Page Sage | Conversion funnel analysis platforms |
| Retention | Churn rate, NPS, customer lifetime value | Under 5% monthly churn is the common target | Retention analysis dashboards, customer feedback |
Want to see how many users actually move through each of these stages on your own site? Our guide on measuring and shortening time to value breaks down the activation metric in more detail.
Implementing Funnels With FullSession
You can build a working SaaS funnel without writing a single SQL query. FullSession’s funnel analysis tool turns scattered events into a clear funnel. It shows how many users reach each step, where they drop, and how conversion changes over time, without manual tracking code.
The product is built around three actions: define, segment, and diagnose.
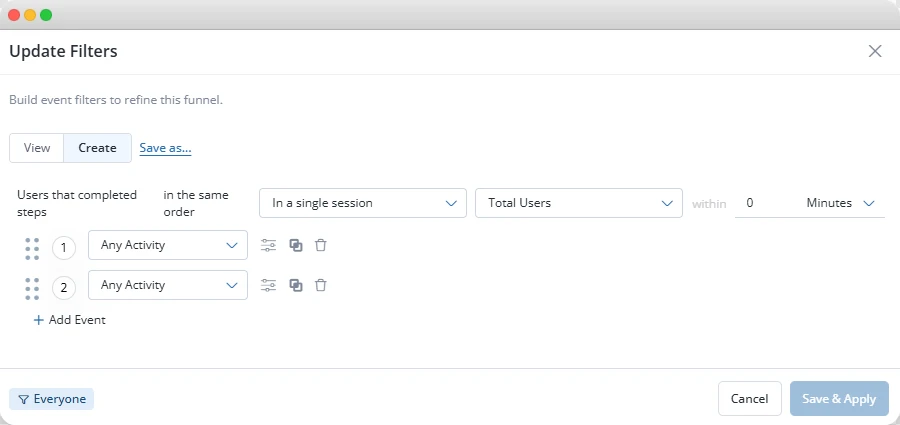
Define your steps
- Choose a journey. Pick one path that matters, like signup to onboarding flow to activation.
- Add three to seven steps. Name each one clearly so anyone on your product team understands it at a glance.
- Set a conversion window. Decide how long users have to move through the funnel before they’re counted as dropped.
- Segment your results. Break the funnel down by device, source, region, or plan.
- Click into the drop-offs. Watch the actual session recordings of users who exited at any given step.
Segment and diagnose
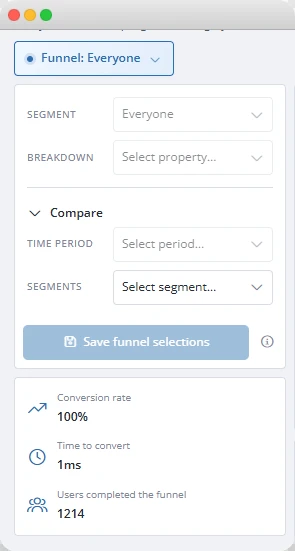
Filtering by device, country, traffic source, or user segment turns “conversion dropped 8% last month” into “conversion dropped 8% for mobile users on checkout.”
Different user segments hide inside one average until you split them apart. This matters even more once you run multiple funnels at once, since each one can hide a different segment problem.
Clicking into a drop-off is where most analytics tools stop short. Plenty can show you that 40% of trial users stalled at “connect your first data source.” Very few let you jump from that number straight into session replay on the same screen.
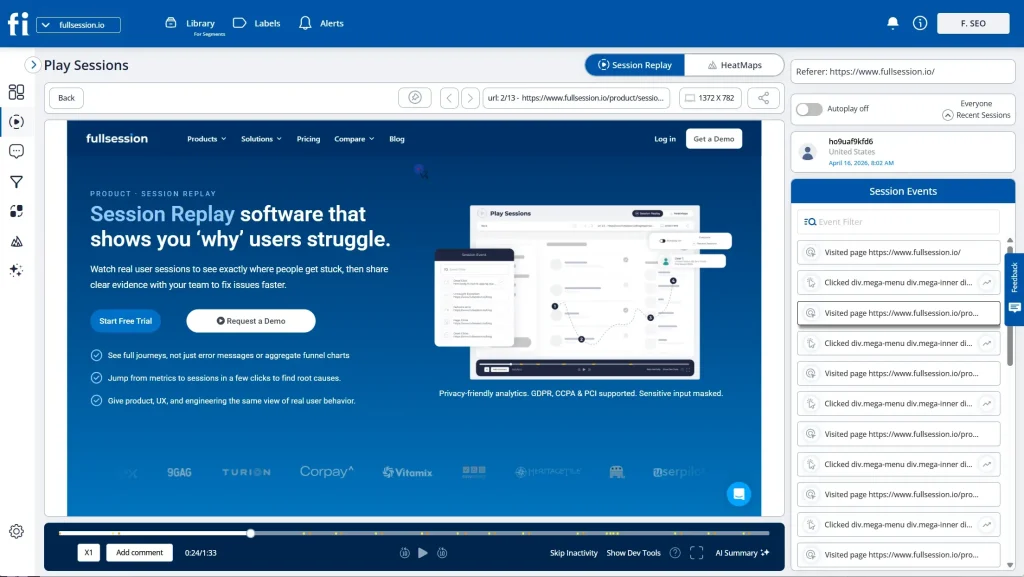
It shows deeper insights a dashboard alone can’t provide about the real user experience behind it.
Why this matters without a data team
Many tools come with a steep learning curve before you can build your first useful funnel. Without SQL knowledge or a dedicated analyst, that requirement becomes a bottleneck you didn’t budget for.
Google Analytics alone won’t close the gap either, since it shows aggregate numbers without session-level context.
FullSession is built for product, growth, and operations teams to share one funnel view and base decisions on it together.
From Setup to Fix, in One Platform
Set up your funnel, segment the results, and watch the sessions behind every drop, all in one place.
Turning Funnel Data Into Actionable Insights With Lift AI
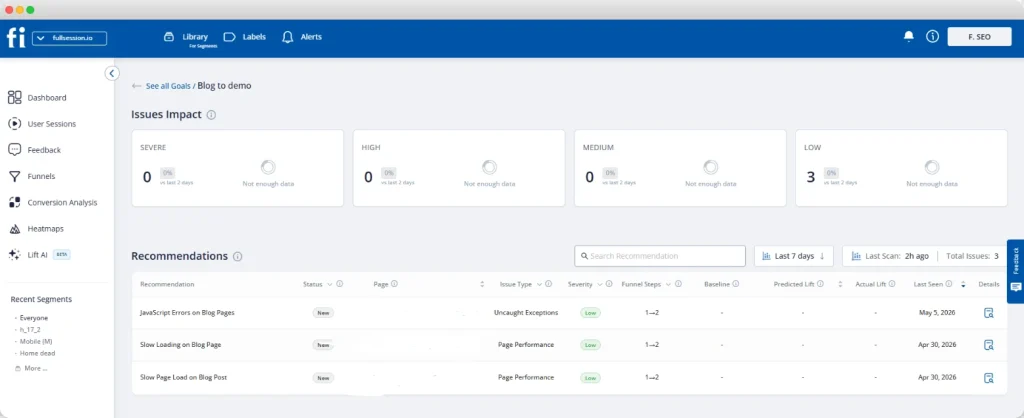
Most product managers have more friction signals than they have time to review. A funnel might show five separate drop-off points, three demographic data gaps, and a handful of rage-click spikes, all in one week.
Lift AI, FullSession’s AI prioritization feature, turns real sessions into a ranked list of opportunities tied to your goals and funnels instead of a wall of charts.
How Lift AI works
The feature runs on three steps. First, you set a goal, like checkout completion, revenue per visitor, or visitor-to-signup. Second, Lift AI determines the best attribution window automatically and analyzes friction, failures, and slowdowns in the sessions tied to that goal.
Third, you get a ranked list of opportunities, each with an expected goal improvement, a confidence score, and evidence links attached.
That evidence matters more than the ranking itself. You’re not just told “fix onboarding step 3.” Opening any opportunity shows the step it hurts, the affected pages, and example sessions.
That structure is what turns a list of optimization opportunities into something your team can actually act on, instead of an AI-generated guess you have to take on faith. It’s what lets Lift AI provide actionable insights instead of vague priorities.
How to validate a recommendation
The validation loop closes the gap that trips up most teams: knowing whether a fix actually worked.
- Review. Open the recommendation and review the linked evidence, including sessions and the impacted step or pages.
- Ship. Make the fix, whether it’s a UX change, new copy, a flow adjustment, or a technical patch.
- Measure. Check impact against a pre/post window or a holdout experiment. Lift AI provides the estimate; your measurement is the source of truth.
This doesn’t replace your product managers or analysts. It gives Growth, Product, UX, and Engineering a shared starting point so they spend time designing solutions, not hunting through dashboards.
Different teams respond to the same fix differently, and advanced segmentation shows which group is driving a drop-off before you build the wrong solution.
Not Ready to Talk Yet?
See your first Lift AI recommendations on your own data within the hour.
Experimentation and Conversion Rate Optimization (CRO)
Finding a drop-off and fixing it are two different skills, and the gap between them is where most funnel work stalls for any SaaS business. A reliable testing process turns conversion tactics into a validated fix, using targeted experiments instead of broad guesses.
- Find the biggest absolute leak. A step losing 300 users out of 1,000 matters more than a step losing 5 users out of 100, even if the second one has a worse percentage rate.
- Watch the sessions behind it. Review 10 to 20 replays of users who exited at that exact step before you guess at a cause.
- Write one specific hypothesis. State the change, the expected outcome, and the evidence behind it in a single sentence.
- Test one variable at a time. Changing the page elements, the copy, and the layout all at once tells you nothing about which single change actually worked.
- Measure the whole funnel, not just the tested step. A fix that improves one step but pushes the same users to drop off one funnel step later isn’t a real fix.
The highest-return tests tend to live in the simplest places: signup form length, onboarding sequence, and the copy on your trial-end upgrade prompt.
None of these require a redesign. They require evidence, a hypothesis, and a willingness to test one thing at a time.
For the full diagnostic workflow behind this process, including how to segment drop-offs and confirm root cause with behavioral proof, see our guide to conversion funnel analysis
Measuring ROI of Funnel Optimization
The ROI of funnel optimization compounds because every improvement applies to every future user, not just this month’s cohort. A one-point lift in your conversion rate isn’t a one-time win. It’s a permanent change to how much revenue the same traffic produces, month after month.
A worked example
Say your trial-to-paid rate sits at 8%. You run 1,000 trial signups a month, so that’s 80 new customers.
Lift that rate to 10% without spending another dollar on acquisition, and the math looks like this:
- Before: 1,000 signups x 8% = 80 new customers a month.
- After: 1,000 signups x 10% = 100 new customers a month, simply by converting more users you were already attracting.
- Revenue impact: 20 extra customers x $150 average revenue per customer = an extra $3,000 in new monthly recurring revenue, every single month, from a fix you made once.
Why this compounds over time
Multiply that across a year and you start to see why optimization often beats a bigger ad budget for sustainable growth. This is also why campaign performance and funnel performance need to be evaluated together.
A campaign that drives potential customers who never convert isn’t actually performing well. It’s just moving the leak earlier in your pricing model funnel, where it’s harder to see.
Privacy, Governance, and Compliance in Funnel Analytics
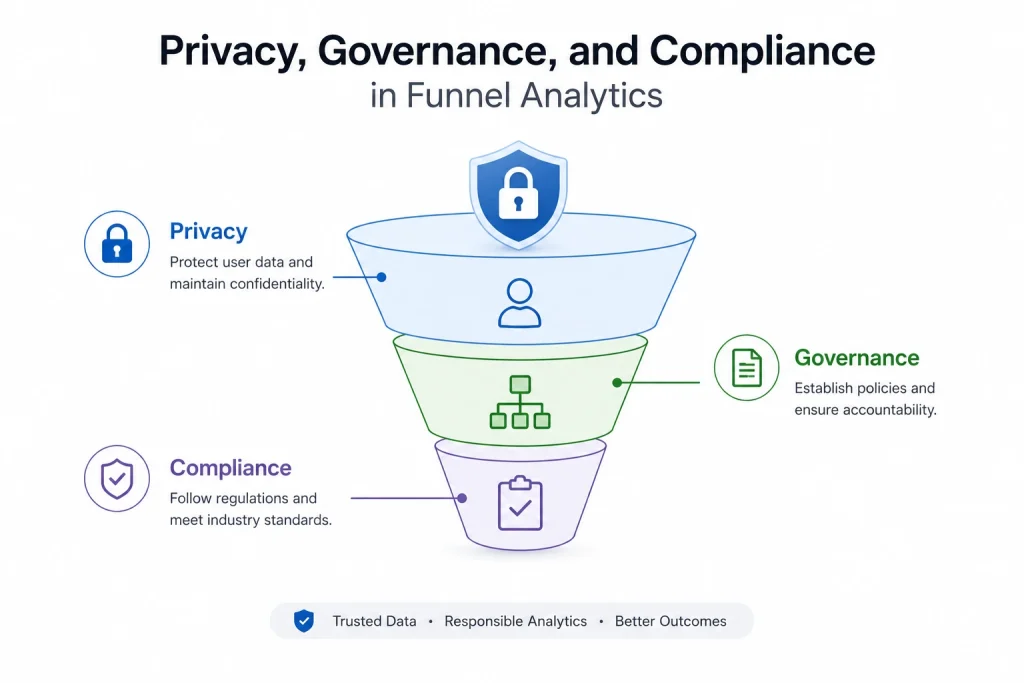
Funnel and session data often qualifies as personal data, which means GDPR and CCPA apply the moment you start tracking real user behavior. This isn’t optional paperwork. It’s a real legal requirement that shapes how you collect and store the user feedback and event data behind your funnels.
A few practical steps keep your tracking compliant without slowing your team down.
- Mask sensitive fields at capture. Passwords, payment details, and other private inputs should never leave the user’s browser in a readable form.
- Set a clear retention window. Decide how long session and funnel data is kept, and document that decision in your privacy policy.
- Use role-based access. Not everyone on your team needs to see every session. Limit access to what each role actually requires.
- Keep a record of consent where required. Depending on your jurisdiction and tracking method, you may need explicit consent before recording begins.
GDPR and CCPA exist to protect individuals, not to block teams from understanding their customer experience.
Built correctly, privacy controls and useful funnel insights aren’t in conflict. They just require you to think about governance before you flip on tracking, not after a customer asks what data you have on them.
FullSession’s safety and security features cover this ground directly. Configurable masking rules hide sensitive fields and elements at capture, role-based access and SSO control who can see what, and audit logs show who accessed which sessions and when.
That combination means your security and legal teams can sign off on funnel tracking without slowing your rollout down.
Common SaaS Funnel Analytics Mistakes
Most analytics failures come from a handful of repeatable mistakes, not from bad tools. Here are the ones that show up most often among SaaS companies.
- Treating Google Analytics, Google’s free traffic and conversion tracking platform, as sufficient on its own. It shows you that users dropped off, but it can’t show you why, because it has no view into session-level user actions.
- Tracking too many funnels at once. A simple funnel with three to seven clear steps beats five overlapping funnels nobody fully understands.
- Ignoring the retention stage focuses everyone needs. Teams obsess over the top of the funnel and treat churn as someone else’s problem.
- Skipping segmentation by signup date or cohort analysis. A funnel that looks stable in aggregate often hides a brand-new problem in last week’s cohort alone.
- Chasing the worst percentage instead of the worst absolute number. A step losing 5% of 10,000 users matters more than a step losing 50% of 100 users find frustrating.
- Assuming real funnel work requires a data engineer. Plenty of teams never start because they think they need SQL knowledge they don’t have, when a visual tool would do the job.
If your current setup mirrors any of these, it’s worth comparing what’s actually available. Our roundup of SaaS analytics tools breaks down the options by what each one is actually built to do.
Conclusion About SaaS Funnel Analytics
SaaS funnel analytics comes down to a short list of habits: track the right metrics, build funnels you can maintain, and pair the numbers with session-level evidence. Add AI prioritization to point you toward the fix worth shipping first, and you stop debating where the problem is and start fixing it.
None of this requires a data team or a SQL course. It just takes a funnel built around your actual user journey and a way to see what happened at the step where users gave up.
See Funnel Tracking and Lift AI Work Together
We’ll walk through how the two connect, from spotting a drop-off to knowing exactly what to fix first.
FAQs About SaaS Funnel Analytics
What is SaaS funnel analytics?
SaaS funnel analytics is the practice of tracking how users move through the stages of a SaaS product, from signup to activation to paid conversion and retention. It measures conversion and drop-off at each step, with the goal of finding which step is losing the most users, then fixing it with evidence instead of guesswork.
What are the key metrics in a SaaS funnel?
The core metrics are conversion rate, customer acquisition cost, churn rate, customer lifetime value, net promoter score, and feature adoption. Conversion rate and churn rate matter most for spotting problems quickly. CAC and lifetime value together tell you whether your funnel is actually profitable.
How do I track a conversion funnel without SQL knowledge?
Use a behavioral analytics platform that lets you define funnel steps visually instead of writing queries. Tools like FullSession let you name each step, set a conversion window, and segment results without touching a database. You click directly from a drop-off into the sessions that explain it.
What is a good SaaS trial-to-paid conversion rate?
According to First Page Sage, opt-in trials convert at an average of 18.2%, while opt-out trials requiring a credit card convert at 48.8%. According to ChartMogul, the broader 2026 median across 200 surveyed products was 8%. Compare your rate against your specific trial model, not a generic average.
How does AI help prioritize funnel fixes?
AI prioritization tools like Lift AI scan behavioral data tied to a specific goal and rank friction points by predicted revenue impact. Each recommendation comes with a confidence score and linked evidence, like affected pages and example sessions. This replaces manual dashboard review with a ranked, evidence-backed list.
Is funnel analytics data covered by GDPR?
Yes, funnel and session data often qualifies as personal data under GDPR and CCPA once it can be tied to an individual user. This means masking sensitive fields, setting clear retention windows, and managing access by role. Compliance requirements apply regardless of which tool collects the data.

Roman Mohren is CEO of FullSession, a privacy-first UX analytics platform offering session replay, interactive heatmaps, conversion funnels, error insights, and in-app feedback. He directly leads Product, Sales, and Customer Success, owning the full customer journey from first touch to long-term outcomes. With 25+ years in B2B SaaS, spanning venture- and PE-backed startups, public software companies, and his own ventures, Roman has built and scaled revenue teams, designed go-to-market systems, and led organizations through every growth stage from first dollar to eight-figure ARR. He writes from hands-on operator experience about UX diagnosis, conversion optimization, user onboarding, and turning behavioral data into measurable business impact.