Author: Mohamed Sehwail
-
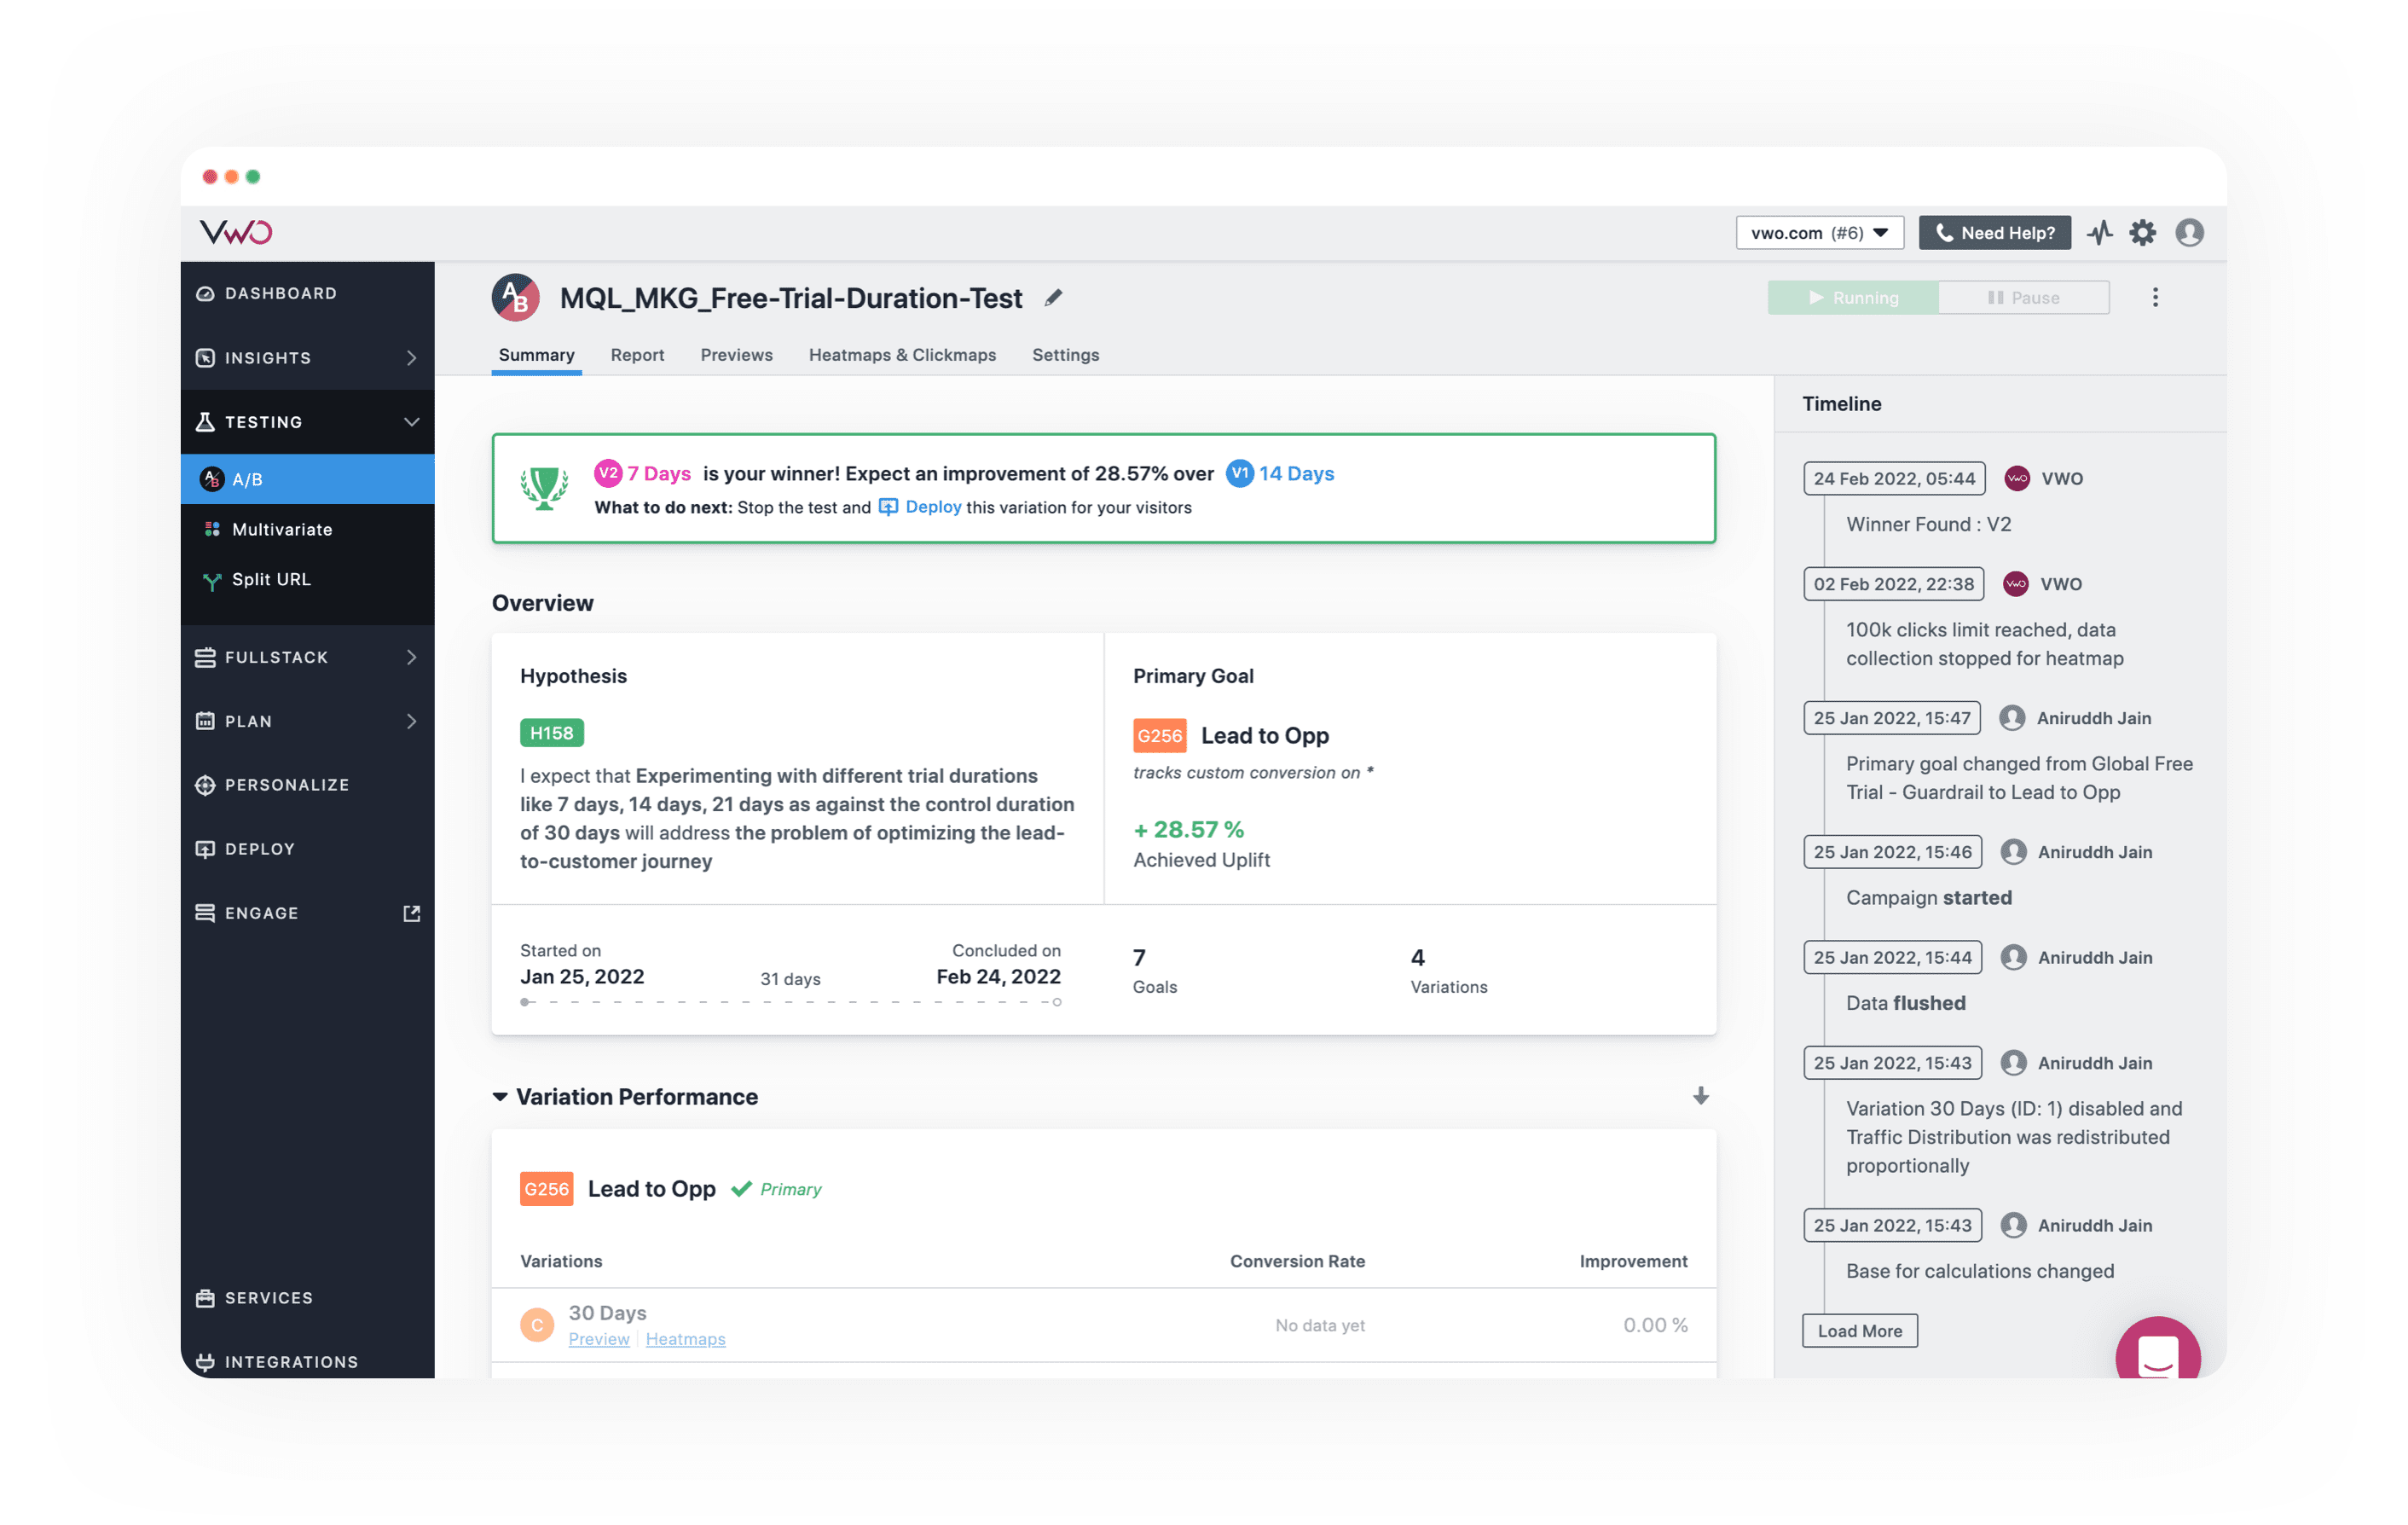
Top 10 VWO Competitors and Alternatives This Year
Are you looking to optimize your website’s performance but unsure if VWO is the right choice? You’re in luck! We’ve compiled a list of this year’s top 10 VWO competitors that can help you improve your site’s user experience and conversion rates. We’ll break down their use cases, key features and pricing and explain how…
-
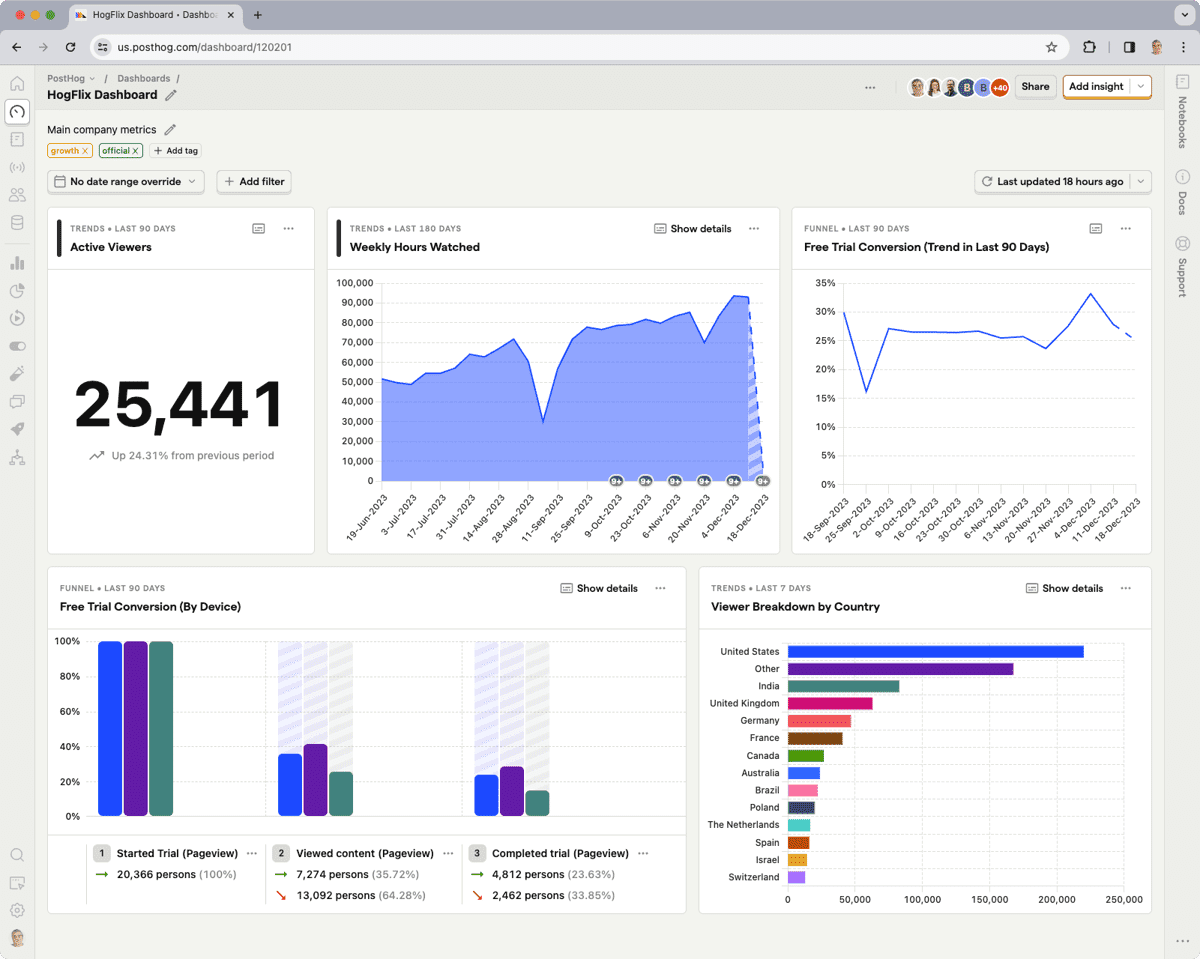
5 PostHog Alternatives and Competitors to Test This Year
PostHog is a product analytics platform that helps developers and engineering teams enhance product development and user experience. Its key features include web analytics, feature flags, session replays, heatmaps and surveys. However, some users have experienced difficulties with data loading, limited data tracking, technical complexity and a high learning curve, leading them to seek PostHog…
-

Looking for the Best Mouseflow Alternative? Check this out!
Are you tired of using Mouseflow for your website analytics? Do you need more advanced features or a fresh approach to understanding your users? Don’t worry, you’re not alone! In this article, we will help you find the best Mouseflow alternative that can help you dig deeper into user behavior, satisfaction, and retention. You’ll discover…
-

UX Audit: The Ultimate Guide for Website Owners
A UX audit can make or break your website. It’s a deep dive into how users are using your site so you can find the problems and solutions. A UX audit looks at your whole website experience, from how people use it to how your site looks. You can see what’s working and what’s not.…
-

User Experience Optimization: Explore the Latest Techniques for 2025
Picture this: It’s 2025, and your digital product is a seamless extension of your users’ lives. Frustration? Gone. Confusion? A thing of the past. Engagement? Through the roof. It isn’t a far-fetched dream—it’s the potential reality of user experience optimization done right. But let’s be real: Users are flooded with options, their attention spans are…
-
25 Website Optimization Tools to Boost Site Performance by 100%
If you own a website, you know how important it is to make it stand out. The best website optimization tools can help you do just that. They improve your site’s performance, enhance the user experience, and increase your search engine rankings, making your website more effective. However, with countless tools on the market, selecting…
-

Web Analytics Tools Comparison: Top 9 Options in 2025
Web analytics tools are essential for understanding how visitors interact with your website, helping you boost performance, fine-tune the user experience, and increase conversions. Take FullSession as an example—it lets you capture all interactions, visualize all user engagement, analyze trends and patterns with laser precision and optimize your website for peak performance. You can start…
-
Conversion Funnel Analysis: How to Get More Sales With FullSession
The ideal customer moves through the conversion funnel with little friction–they view your website, click on your CTAs, and dive head-first into your desired action. Done! Unfortunately, real-world customers aren’t like that. Sure, some may convert into repeat customers without much pushing, but most will need convincing that you are the #1 solution to their…
-
Digital Experience Analytics: The Ultimate Guide For 2026
Digital experience analytics gives you the tools to track, measure and improve users’ engagement with your digital platforms. It lets you collect and analyze user data from websites or apps, combining behavioral data with technical metrics to give you a complete view of the customer journey across various digital touchpoints. The best digital analytics tools…
-
We Tried Hotjar vs Microsoft Clarity: Here’s Our Feedback
Customer experience analysis is complex. Despite your best efforts, you might misinterpret user data or miss crucial website usability issues. User behavior tools can simplify this process, offering accurate and relevant insights into website performance and user experience. Hotjar and Microsoft Clarity are popular user behavior analytics software that provide insights into how users interact…