Author: Mohamed Sehwail
-

Top 9 Behavioral Analysis Software Tools of 2025
Behavioral analysis software is a must-have for companies to understand user interactions and optimize digital experiences. These user behavior tools give detailed insights into how users navigate web and mobile apps. Behavioral analysis software tracks and analyzes user interactions to reveal patterns in digital engagement. Its purpose is to help you understand user journeys, identify…
-

5 Hotjar Alternatives That Won’t Break the Bank (But Will Boost ROI)
Hotjar is a website heatmap and behavior analytics tool that helps you see how users interact with your website. It offers heatmap tools, session recordings, surveys, funnels, user tests and interviews, and feedback polls to let you visualize user actions, find areas for improvement, and optimize the user experience. NEXT STEPS Apply this to your…
-

How to Get More Conversions on Shopify: 9 Expert Tips for Success
Increasing your conversion rate is key to your Shopify store success. A higher conversion rate means more sales, improved ROI and a healthy online business. But how can you turn more of your visitors into paying customers? In this ultimate guide, you’ll learn: We’ll also introduce you to FullSession, an all-in-one user behavior analytics software…
-

Why You Need a Mouse Heatmap for Website Optimization
As a website owner, you’ve probably struggled to understand why visitors aren’t converting or why certain pages have high bounce rates. If traditional analytics leaves you confused, a mouse heatmap can solve these problems best. Mouse heatmaps give you visual insights into user behavior so you can identify and fix website issues faster, increase user…
-

9 Best UX Heatmap Tools to Optimize Your Websites and Apps
UX heatmap tools visually represent user activity on web pages or app interfaces through color-coded overlays. They highlight hot and cold areas where users click, scroll and move their cursor. By showing you user behavior patterns, heatmaps give you practical insights to inform design changes and improve the user experience. This visual approach to data…
-
Customer Journey Analytics: The Best Guide in 2025
For a website owner, understanding the entire customer journey is the key to success, and that’s where customer journey analytics comes in to help you examine customer interactions across various channels and improve their experience and satisfaction. The best customer journey analytics software like FullSession can collect customer data and offer detailed insights into customer…
-
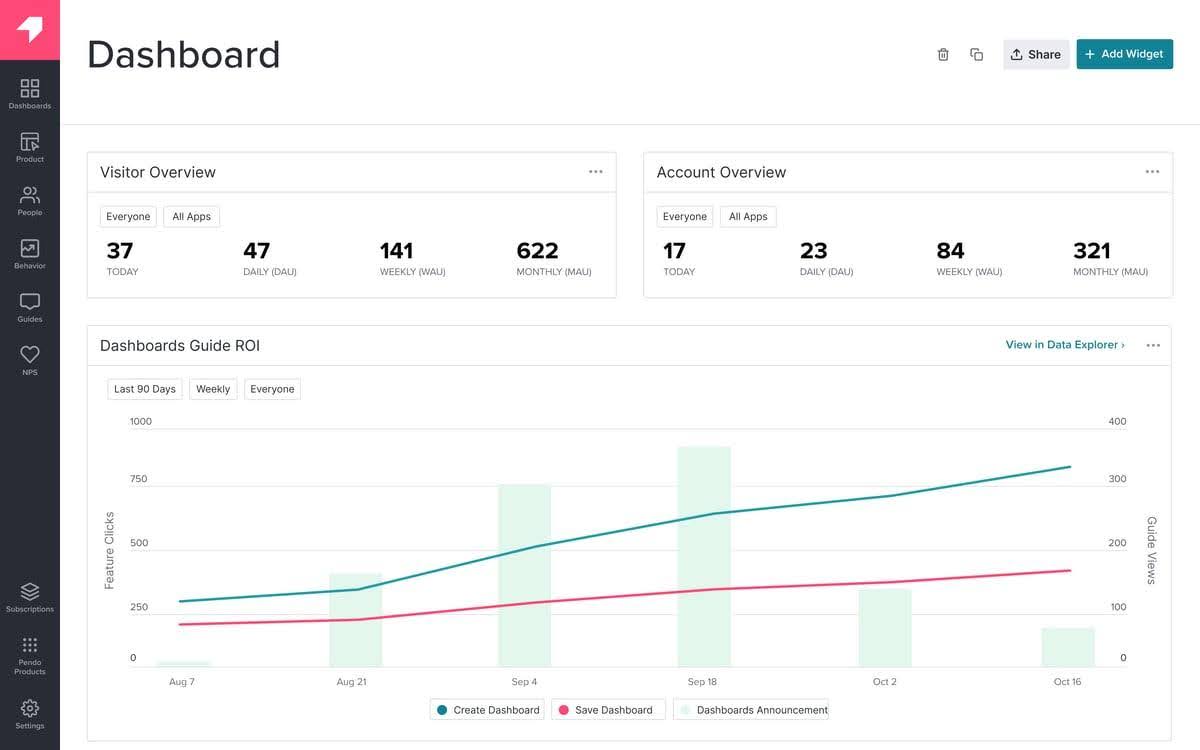
5 Best Pendo Competitors and Alternatives to Analyze User Behaviors
Pendo is a product experience and digital adoption software offering in-app guidance, product adoption, and feedback tools, so it’s a no-brainer for companies looking to improve user onboarding and customer engagement. While Pendo has useful features, the pricing structure can be a barrier for smaller companies. Its free tier provides limited features, and some customers…
-
5 Best Alternatives to Google Analytics for Superior Insights
Google Analytics is one of the best website visitor tracking software that helps you track, monitor and analyze the performance of your digital products. While free, its limitations with data collection methods, migration difficulties, sampling issues, and complexity prompt users to look for alternatives. Customers often switch to user behavior tools that go beyond raw…
-

25 Ecommerce Conversion Optimization Strategies to Boost Your Sales
Optimizing eCommerce conversion rates can make a big difference to your sales. You need to focus on making the shopping experience easy and fun for your customers. Whether you’re a small online store or a big retailer, knowing what makes your customers purchase is key. Happy customers are more likely to return. By putting their…
-

5 Best Website Usability Testing Software Right Now
Website usability testing software allows you to evaluate how easily users can navigate and interact with a website or application. It involves observing real users engaging with a product to find areas of confusion or difficulty that could hinder user experience, impacting conversion rates and customer satisfaction. For example, FullSession enables you to derive actionable…