.svg)

Increase form completion rate with a prioritization framework (not just a checklist)

What is “form completion rate” (and what it is not)
Form completion rate is the share of users who start a form and successfully submit it. It is often confused with abandonment rate (start but do not submit) and step conversion (completion per step in a multi-step flow).
In SaaS, higher completion only matters if it improves activation. Some “improvements” raise signups but lower Week-1 activation if they remove qualification or hide friction users must still face.
The 10-minute diagnosis: find where completion breaks
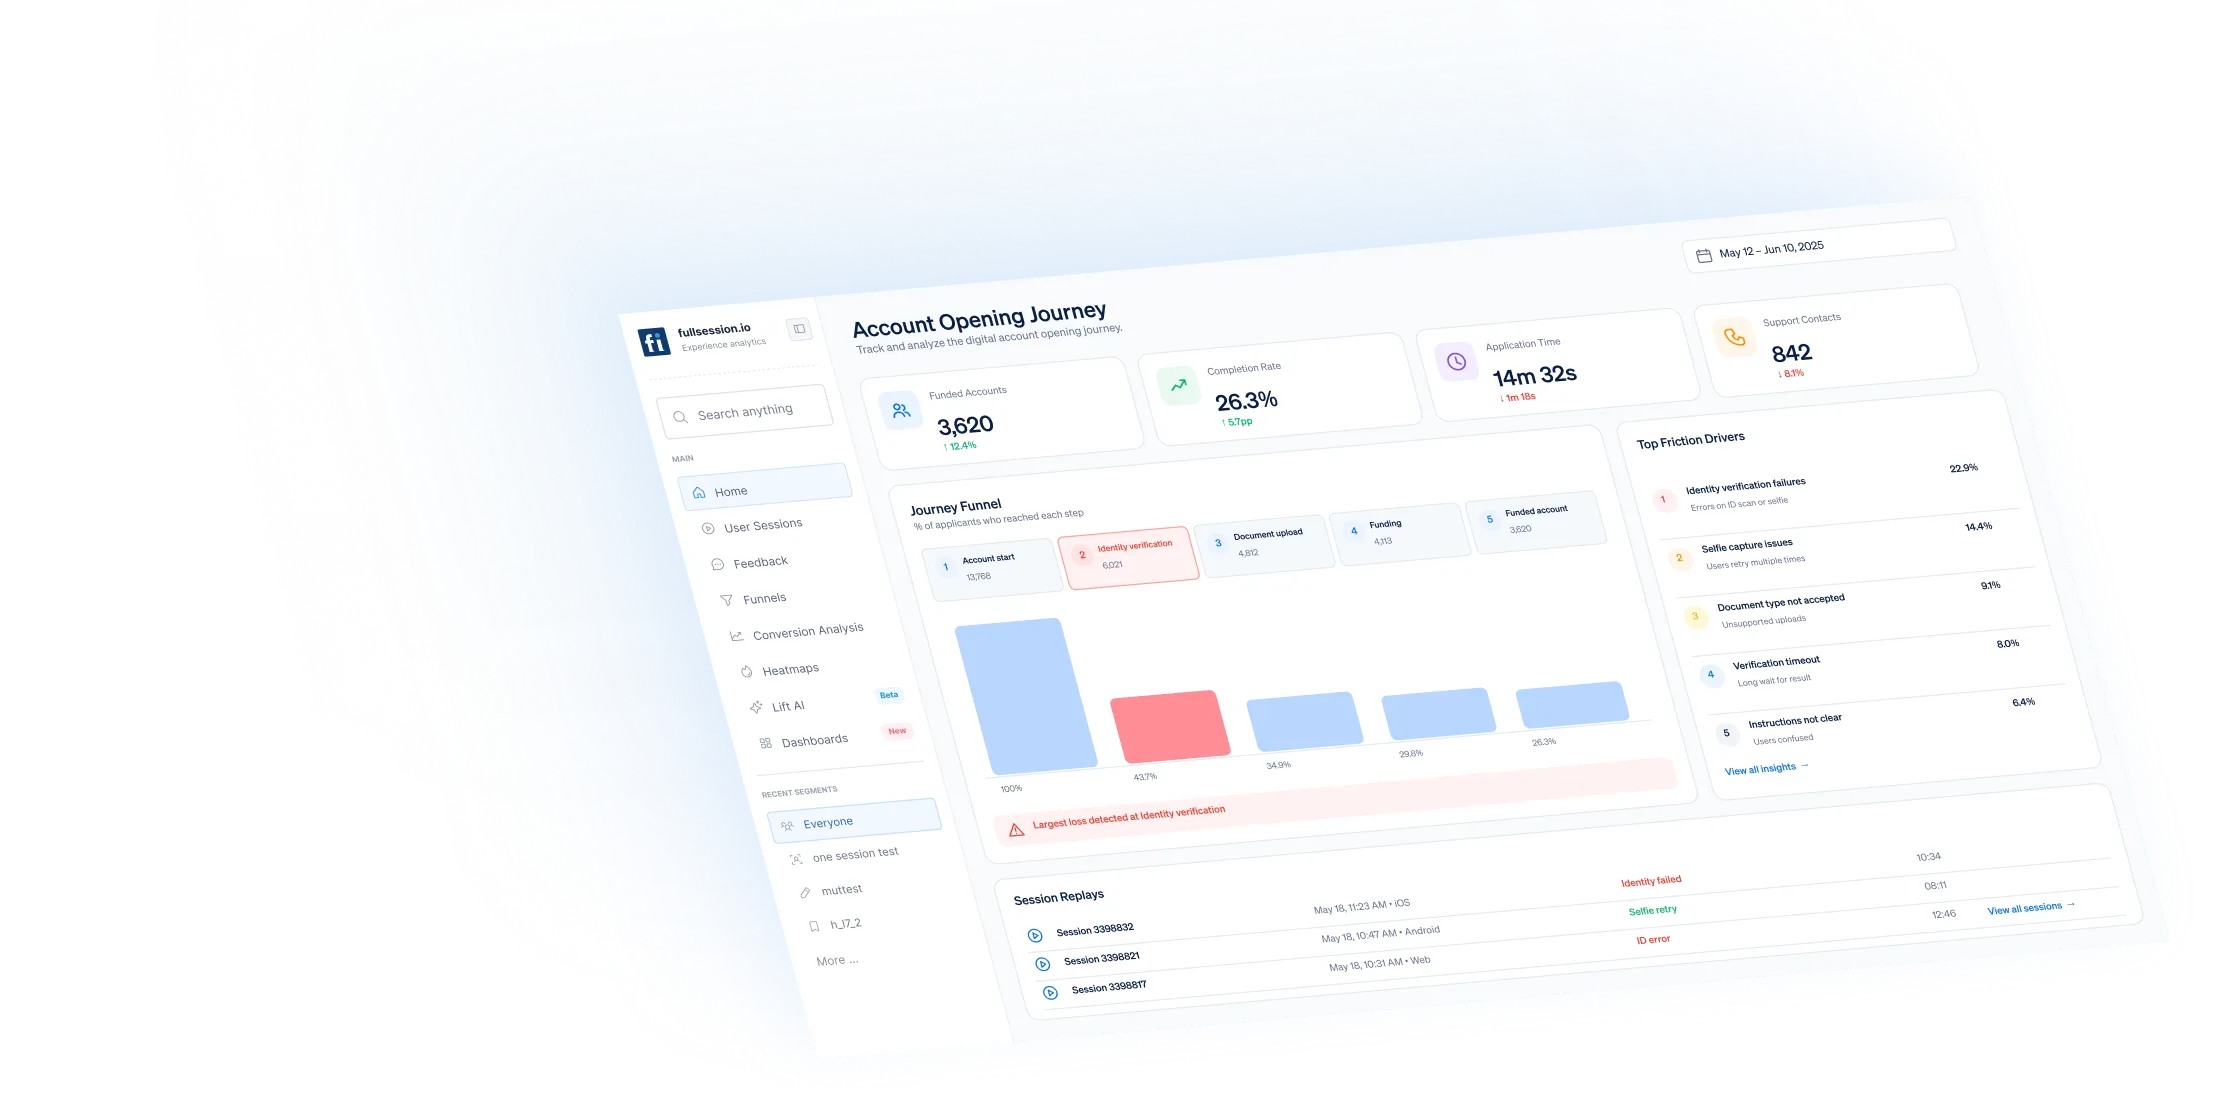
Before changing UI, diagnose the dominant failure mode. Start in Funnels and conversion analysis to find the step or page where entrants fall sharply, then validate what is happening with Session replay and Errors and alerts.
Workflow
- Segment drop-off by device, source, and new vs returning.
- Localize to the worst step and the field that triggers exits, high errors, or long dwell time.
- Classify the friction signature: effort, uncertainty, trust, or technical failure.
- Choose two to four “why” metrics: error rate, time-to-complete, retries, submit latency.
Prioritize with a simple rubric (form type + friction signature)
Most best practices are correct, but not equally high leverage. Use your form type (signup, onboarding, billing) and the friction signature you observed to choose the top 2–3 changes.
Fixes mapped to four failure modes
Pick 2–3 interventions based on the failure mode you diagnosed: effort, uncertainty, trust, or technical failure.
Effort
Remove fields that do not change routing, use progressive profiling, and avoid slow input widgets. Use multi-step only when it reduces perceived effort and you can show progress clearly.
Uncertainty
Rewrite labels in user language, show examples and accepted formats near the field, and add short “why we ask” microcopy.
Trust
Place concise reassurance near sensitive fields, link policies where the question arises, and keep consent language explicit.
Technical failure
Debounce validation, make errors actionable, prevent double submits, and handle latency explicitly. If failures are hard to reproduce, connect Errors and alerts to Session replay.
Validate outcomes beyond completion rate
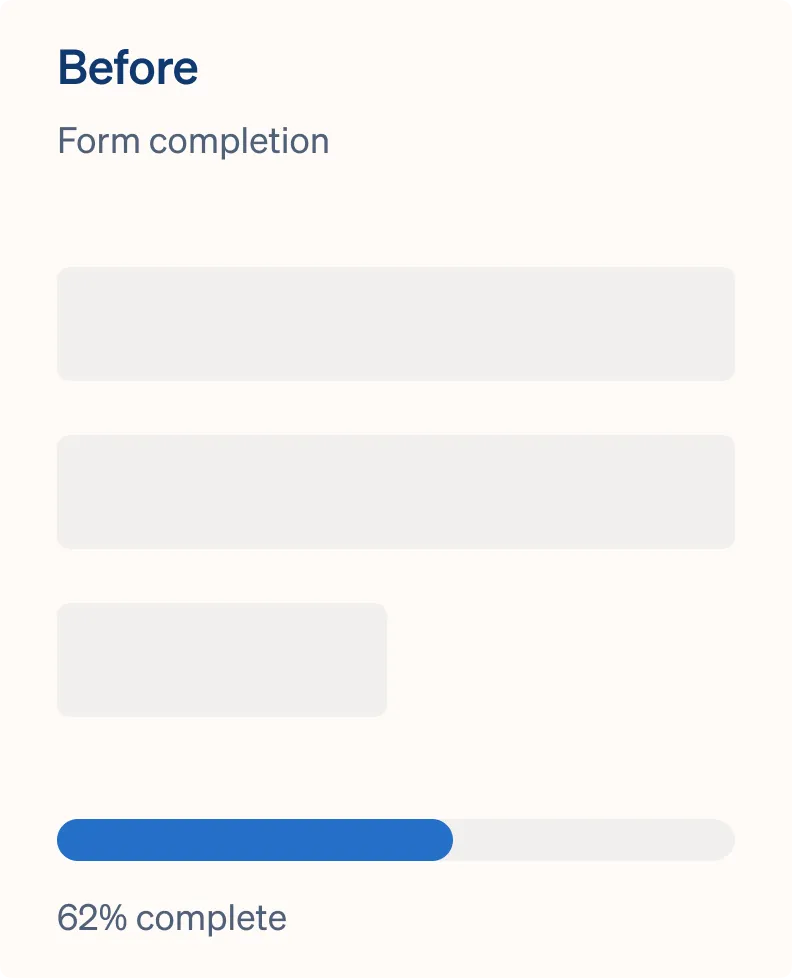
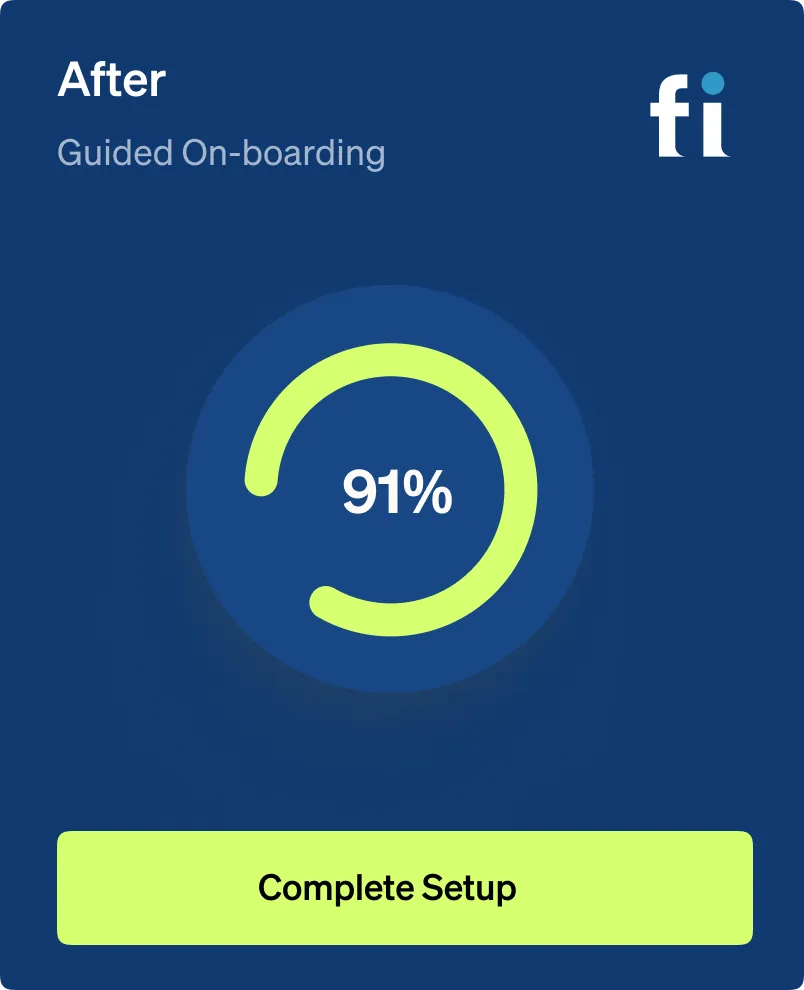
Track completion rate, error rate, time-to-complete, and an activation quality metric (first key action). Compare cohorts before and after to ensure lift is real and not shifted downstream.
Use the same workflow to iterate: diagnose, prioritize, fix, validate. This is where PLG activation teams move faster because evidence is shared, not debated.
Implementation notes engineers miss
Input masking pitfalls, localization, accessibility, autosave, and submit observability often explain why “best practices” did not move completion. For mobile-heavy traffic, review Mobile session replay early to spot tap and keyboard issues.
Related answers
Common follow-up questions
It depends on intent and stakes. Compare your own baseline by device and source, then fix the worst segment first.
Use multi-step when it reduces perceived effort or groups distinct decisions. Avoid it when it only adds clicks. Validate with step conversion and time-to-complete.
Look for exits, high errors, and long dwell time after focus on a field. Pair quantitative signals with session review to confirm the cause.
It can. Keep one activation guardrail metric (first key action) and compare cohorts before and after the change.
Over-strict validation, timeouts, failed API calls, and double-submit behavior are common. Treat these as reliability issues, not just UX.
Make them specific and fixable: what is wrong, what is accepted, and how to resolve it. Avoid generic “invalid” messages.
See what’s costing you, and prove whats fixing it is worth
Watch the real journey, rank every issue by revenue impact, and validate the result against baseline.



.svg)
.svg)
212 E Stone Path St Derby, KS 67037 Phone: +1 415-649-4222



All systems operational.