Author: Roman Mohren (CEO)
-

User onboarding best practices: how teams decide what actually matters
User onboarding best practices only work when they’re prioritized and validated in context. Start by identifying your activation moment, find the highest-friction step that blocks it, choose the smallest onboarding change that should reduce that friction, and validate impact with activation quality and time-to-value not just completion rates.
-
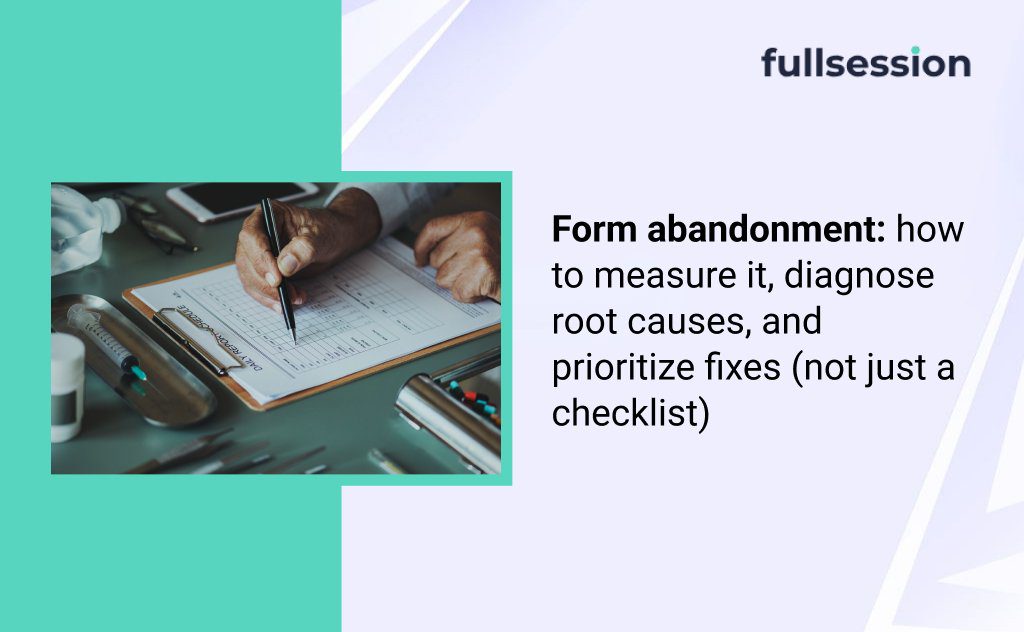
Form abandonment: how to measure it, diagnose root causes, and prioritize fixes (not just a checklist)
Form abandonment is when a user starts a form but leaves before a successful submit. To reduce it, measure drop-offs at the step and field level, diagnose whether the blocker is intent, trust, ability, usability, or technical failure, then prioritize fixes by drop-off × business value × effort, with guardrails for lead quality.
-
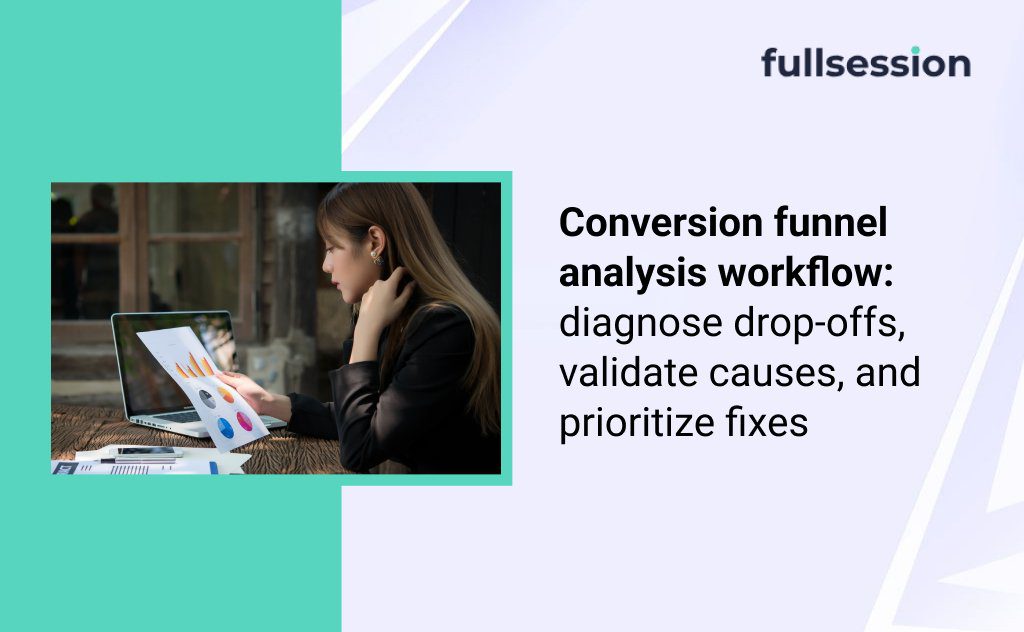
Conversion Funnel Analysis: How to Find Drop-Offs and Improve Conversions
Conversion funnel analysis is most useful when you treat it like a diagnostic workflow: validate tracking and step definitions first, segment to find where the drop-off concentrates, form competing hypotheses, confirm the “why” with qualitative evidence, then prioritize fixes by impact/confidence/effort and validate outcomes with guardrails. Use tools like FullSession Lift AI to move faster…
-

Product analytics is only useful if it changes what you build next
Most SaaS teams collect plenty of metrics. The harder problem is making sure those metrics actually drive decisions, not debates. What is product analytics? (Definition) Product analytics is the practice of measuring how people use your product so you can make better product decisions, validate outcomes, and prioritize work. If your KPI is activation, product…
-

UX analytics: From metrics to meaningful product decisions
Most activation work fails for a simple reason: teams can see what happened, but not why it happened.UX analytics is the bridge between your numbers and the experience that created them. Definition box: What is UX analytics? UX analytics is the practice of using behavioral signals (what people do and struggle with) to explain user…
-

Ecommerce Conversion Optimization: A Practical CRO System for Prioritizing, Testing, and Proving Lift
Most ecommerce teams do not have a “tactic problem.” They have a decision problem. You can find endless lists telling you to add reviews, tweak your checkout, or speed up pages. The harder part is knowing what to do first, how to prove it worked, and what to do when the data is noisy or…
-

UX Analytics in Practice: A Framework for Choosing Metrics, Tools, and What to Fix Next
UX analytics combines outcome metrics like funnels and cohorts with behavioral evidence like session replay, heatmaps, and feedback to explain why users struggle. For PLG SaaS, use HEART and Goals-Signals-Metrics to pick activation-relevant measures, triage issues by reach and severity, and validate fixes with a primary activation metric plus guardrails.
-
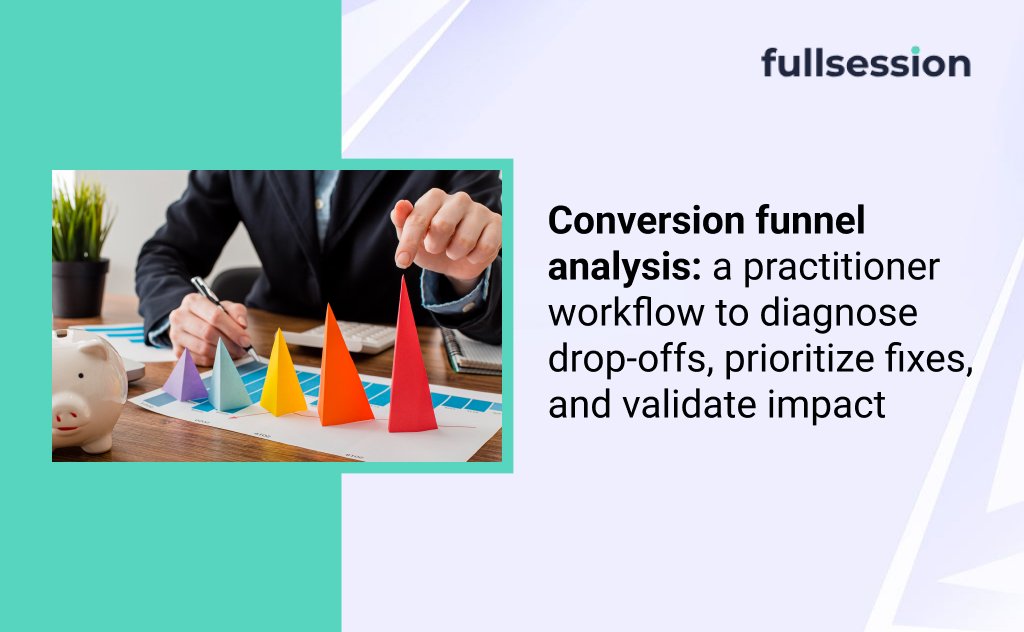
Conversion funnel analysis: a practitioner workflow to diagnose drop-offs, prioritize fixes, and validate impact
Conversion funnel analysis measures how users move through a journey, pinpoints where they drop off, explains why it happens, and validates fixes. A practical workflow starts with clean instrumentation and time windows, then uses segmentation to isolate the story, session evidence to diagnose friction, a prioritization rubric to pick the best fix, and experiments or…
-

Top website feedback tools for marketing agencies: how to choose based on workflow, clients, and outcomes
Agencies do not lose time because they lack feedback. They lose time because feedback arrives in the wrong format, from the wrong people, at the wrong moment, and with no clean path to “shipped”. If you lead delivery, your real job is to prevent review churn while still improving your SaaS clients’ activation. That requires…
-

LogRocket alternatives (2026): how to choose the right session replay + debugging stack for your team
LogRocket alternatives include both replacement replay tools and complementary stacks that pair replay with error monitoring and observability. The right choice depends on your primary job-to-be-done: MTTR-focused debugging, UX optimization, product analytics, or governance and self-hosting. Shortlist 2–3 options, then validate with a 7–14 day proof-of-value using real incidents, clear success metrics, and privacy review…