Author: Roman Mohren (CEO)
-

Hotjar alternatives for PLG B2B SaaS: how to choose the right heatmaps and session replay tool
Choosing a Hotjar alternative is easiest when you start with the job you need done: explain activation drop-off, debug issues, run research, or meet strict privacy needs. Build a shortlist by category, then run a two-week parallel pilot with clear success criteria, governance checks, and workflow validation. Decide based on time-to-insight and confidence in activation…
-
How to Choose a Session Replay Tool (And When to Pick FullSession)
How to Choose a Session Replay Tool (And When to Pick FullSession) You already have session replay somewhere in your stack. The real question is whether it’s giving product and engineering what they need to cut MTTR and lift activation—or just generating a backlog of videos no one has time to watch. This guide walks…
-
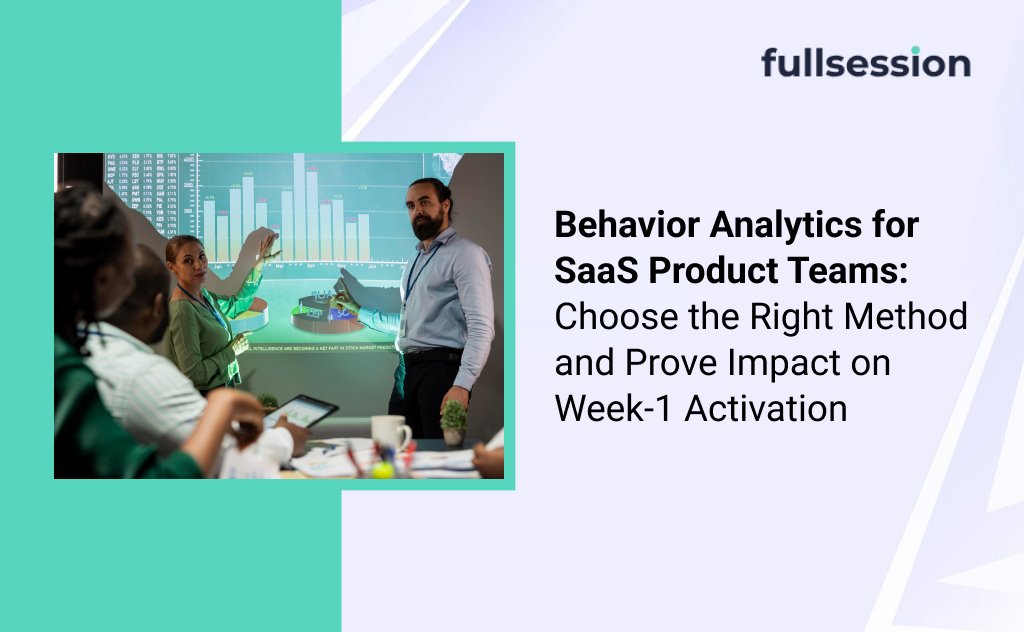
Behavior Analytics for SaaS Product Teams: Choose the Right Method and Prove Impact on Week-1 Activation
Behavior analytics helps SaaS product teams understand what new users do and why, so activation fixes are evidence-driven. Start by mapping Week-1 activation as a segmented funnel to find the leak, then use targeted session evidence to identify the repeated failure mode. Ship one focused change and validate impact with a baseline, a leading indicator,…
-

FullStory alternatives: how to choose the right session replay or DXA tool for Week-1 activation
Choosing among FullStory alternatives starts with the job you need done: session replay for “why,” product analytics for “where,” enterprise DXA for governance-heavy journeys, or dev troubleshooting for repro and errors. Shortlist by tool type, then run a 2 to 4 week pilot on one activation-critical journey. Measure time-to-insight, findability, and whether the tool produces…
-

Customer Experience Analytics: What It Is, What to Measure, and How to Turn Insights Into Verified Improvements
Customer experience analytics combines behavioral, feedback, and operational signals to explain why customers succeed or fail across a journey. For high-stakes flows, focus on completion rate, step conversion, error rate, and cohort splits. Use a closed-loop workflow to diagnose top failure modes, prioritize fixes by impact and effort, and verify results with controls before monitoring…
-
LogRocket vs FullSession: how to choose when “time-to-fix” is the KPI
Comparing LogRocket vs FullSession comes down to your bottleneck. If you need fastest reproduction for engineers, prioritize debugging-first workflows. If your time-to-fix is slowed by handoffs and repeat incidents, prioritize workflows that validate impact and support cross-role evidence sharing. Run a one-week trial on two real incidents and include governance checks early.
-

Checkout Conversion Benchmarks: How to Interpret Averages Without Misleading Decisions
Checkout conversion benchmarks are useful only when you match the metric definition, segment the gap (device, user type, payment method), and confirm the trend is stable. Use published ranges as context, not targets. Act when underperformance is sustained, concentrated, and tied to RPV. Otherwise, monitor and avoid shipping changes based on noise
-

Rage clicks: how QA/SRE teams detect, triage, and verify fixes
Rage clicks are rapid repeated clicks or taps on the same UI area when users expect a response and do not get one. For QA/SRE teams, they can shorten MTTR by pinpointing where and when failures happen. Detect clusters in aggregate, segment to reduce false positives, triage by reach and criticality, then validate fixes with…
-
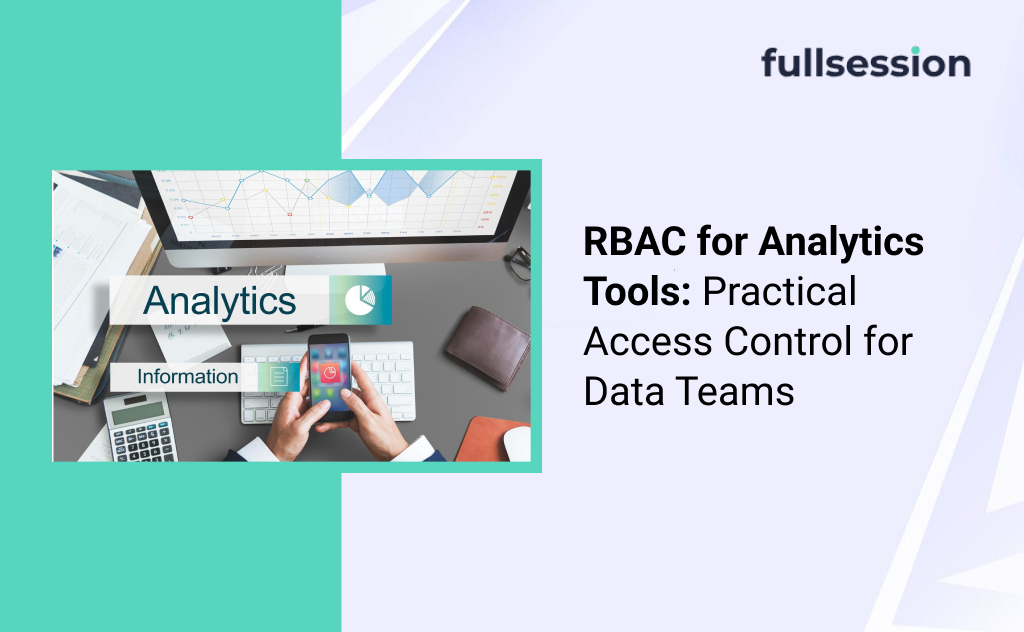
RBAC for Analytics Tools: Practical Access Control for Data Teams
RBAC for analytics tools is role-based access control applied to analytics data, product areas, and capabilities like export and sharing. Practical RBAC starts by separating data, experience, and capability layers, then restricting irreversible exposure points first. Use a small set of stable roles, a time-bound exception process, and a recurring access review rhythm to prevent…
-

Heatmap analysis for landing pages: how to interpret signals and decide what to change
Heatmap analysis for landing pages helps you spot where visitors click, scroll, and get stuck, but it should be treated as hypothesis input, not proof. Segment heatmaps, prioritize CTA-adjacent friction, validate “why” with funnels and session replays, then ship small changes you can measure against activation outcomes.